In the previous chapters, we touched upon the basics of reading crypto charts. We learned the theory behind crypto charts, their importance, the time frames, and the market basics. In the second chapter, we started our journey by learning about the technical requirements needed to read the charts accurately: the definition of candles, how to observe the volume, etc. Today, we will explore the most exciting part so far - the patterns. Millions of traders used their experience and knowledge to distinguish unique patterns in the market to predict future price movements.
Hammer Pattern
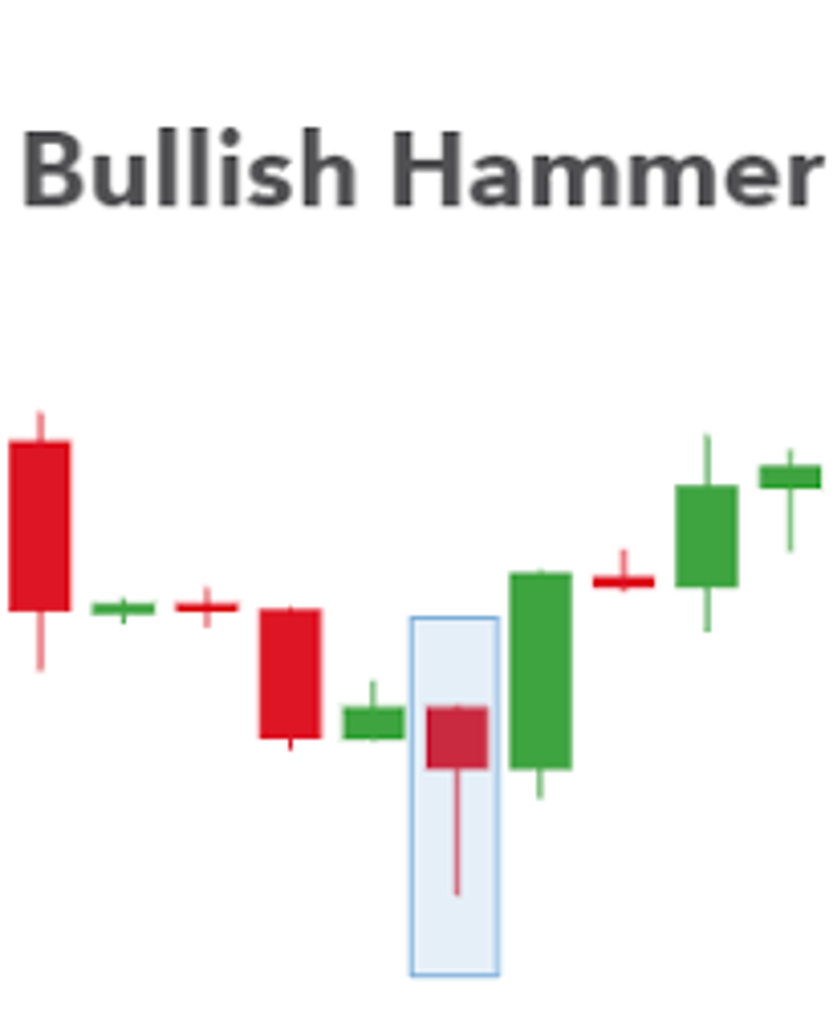
A hammer is a bullish reversal pattern that occurs at the bottom of a downtrend. It forms when there is a drop in the price. In this pattern, the candlestick’s wick resembles the handle of a hammer and the full-body head of a hammer, hence the name.
This pattern is significant because it tells you a lot about the behavior of buyers trading cryptocurrency. It usually means that more buyers are entering the market strongly. And the closing price will end high than the opening price despite the downtrend.
Bullish Engulfing Pattern
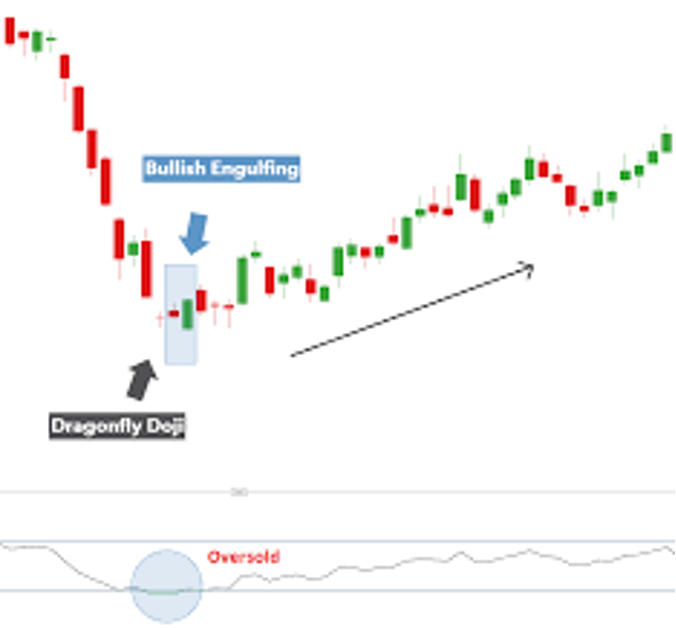
This pattern is unique because it has two candlesticks. One candlestick is bearish and the second is bullish. But the main difference here is that the bullish candlestick is much bigger than the bearish candlestick.
The size of the bullish candlestick engulfs the body of the bearish candle, hence the name. It means that at some point on the crypto chart, the selling of the cryptocurrency was exhausted and buyers entered the market even stronger than before. And this is what causes the reversal.
Morning Star Pattern
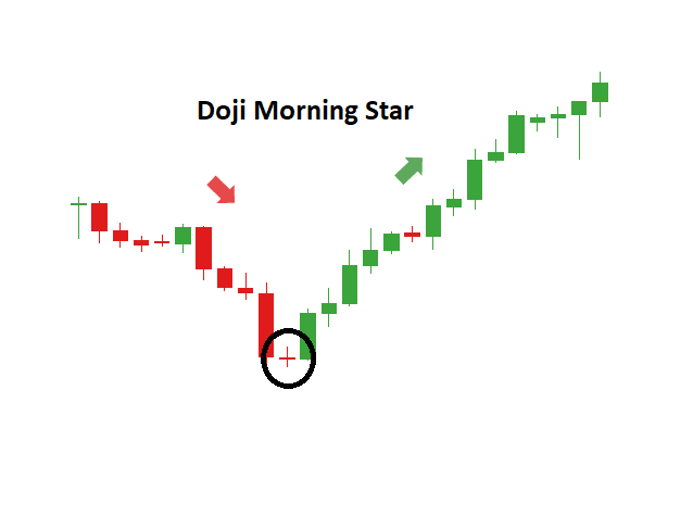
The morning star pattern has three candlesticks. The first candlestick is bearish. The second is more minimal in range but the third candlestick is bullish with a very aggressive increase in price.
This pattern indicates reversals in downtrends preceded by a moment of indecision by the sellers.
Bearish Reversal Patterns
The bearish reversal pattern is the second candlestick indicator. And unlike the bullish pattern, this pattern indicates a reversal or change of direction from a positive or uptrend to a downtrend. This means that these patterns will appear at the peak of market movements on crypto charts.
There are three bearish patterns we will cover here in learning how to read crypto charts.
Shooting Star Pattern
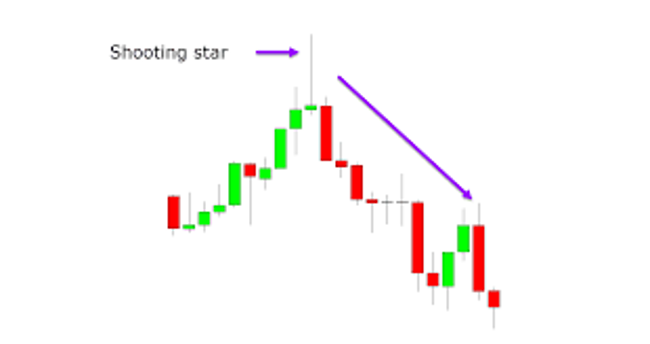
The shooting star pattern, a type of bearish reversal pattern is named after a falling star to explain the change in the movement of the cryptocurrency price from an uptrend to a downtrend.
This pattern has a single candlestick. It will have a long upper wick, a short body, and little or if any lower wick at all.
It usually indicates that sellers are entering the market strong. There is a strong push by buyers of the cryptocurrency on the market but it isn’t enough to fully overshadow the sellers. The pressure to sell the cryptocurrencyincreases and causes a downward trend.
Bearish Engulfing Pattern
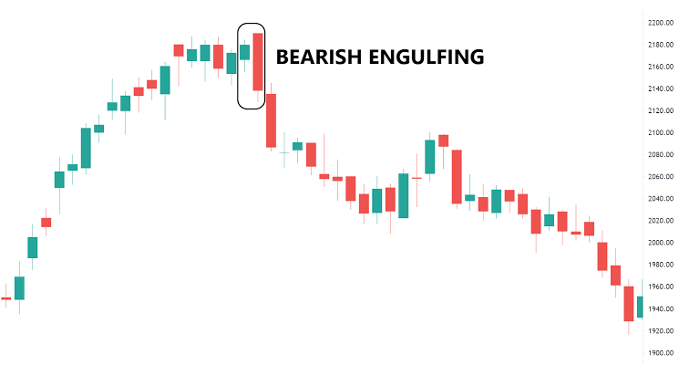
The bearish engulfing pattern is the opposite of the bullish engulfing pattern. It does comprise of two candlesticks. But the first candlestick is bullish while the second is bearish and far greater than the bullish candlestick. In this pattern, the bearish candlestick engulfs the bullish.
This means that sellers entered the market strong in the second candlestick and forced the closing price to be lower than the previous one.
Evening Star
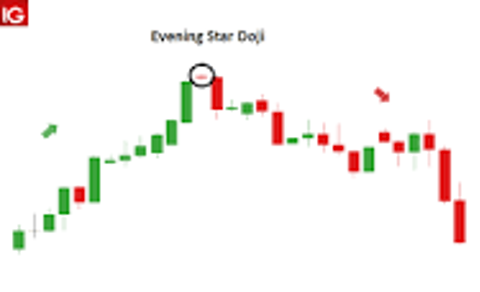
The evening star pattern has three candlesticks. The first candlestick holds a bullish position. The second candlestick has a minimal range. But the third candlestick is what breaks the deadlock; it is a strong and rather aggressive bearish candlestick and this is where it closes.
This pattern usually indicates that at the opening of the market, buyers of the cryptocurrency held a strong position but there is a deadlock on the second candlestick. However, the hand turns in favor of the sellers and the crypto trade ends bearish.
The movement of the crypto market is quite volatile and can change in direction at any given time. Many factors can influence the movement of cryptocurrency in the market and it is important to know these factors in learning how to read crypto charts.
The Dow theory provides a fundamental structure that helps traders understand what affects crypto markets. It was developed for the stock market but can be applied to cryptocurrency charts as well.
The Dow Theory
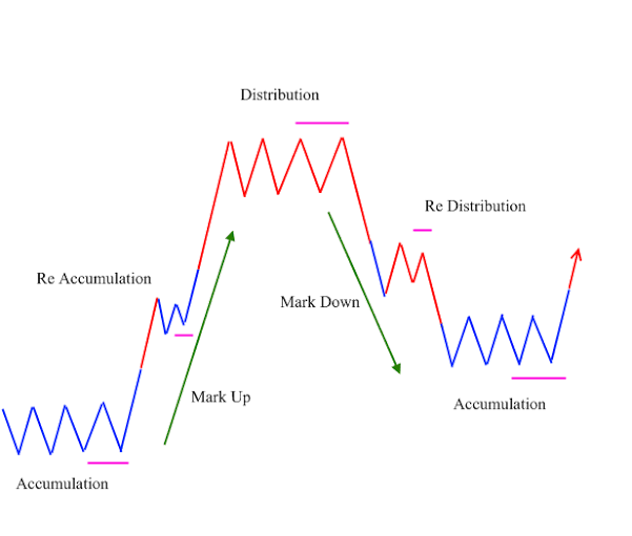
We have distilled the Dow theory into the following simple and easy to digest points:
● The market factors everything in determining its pricing- everything from current, previous, and even upcoming news are put on the table when setting up the current price of the cryptocurrency.
● In trading crypto, there is a wide and growing number of variables that can affect the market. These could be regulations, news past and present, and future projections as well.
● The price of a cryptocurrency on the market is anything but random. They have been known to follow trends and this can be for the long term or short term.
● The crypto market analysts do not take into consideration the factors that produce the price of the cryptocurrency. They are more interested in the price itself.
Why is this important to note? The Dow theory shows us that trends can be repeated again and again especially when the same conditions are in play. This offers an olive branch to crypto traders. Traders can use these trends to predict market behavior when certain patterns emerge.
To further understand this, the Dow theory has six tenets made up of three market movements and three market trends.
To be continued…
I hope you don’t feel overwhelmed after learning all these new technical terms. Now, you fully understand the bullish and bearish patterns, how to distinguish between evening and morning stars, and how to behave when seeing a hammer. Also, you’re probably getting the idea that trading is far from intuitive. There’s a theory that the graph is everything you may need to trade, as it already reflects the demand, supply, news, and everything else that influences the price. In our last chapter, I’ll share some of the resources that may be helpful for you to use daily.