The market is exceptionally volatile now, which can be an opportunity to make enormous profits, for professional traders. However, less experienced crypto investors and beginners may be less fortunate in such times. To avoid a disastrous outcome, let’s further explore how to read crypto charts. Today, we’ll get technical.
The Japanese Candlestick

If you are an established trader, the term candlestick will be one you are most likely familiar with. The Japanese candlestick chart is the second most common cryptocurrency chart type. The first of course is the line chart.
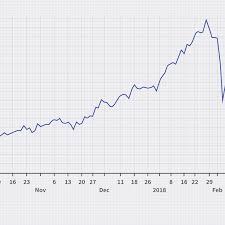
The choice between crypto candlestick charts and a line chart is personal to you. It is important that you choose what works best for you. In this article, we will cover crypto candlestick charts because of several benefits they offer.
The name is derived from a Japanese trader who developed the technique. The candlesticks are graphical representations of price movements with different colors to show changes. Candlesticks can vary in size, shape, color, or length. And each of these are set up to provide useful information for traders on the market.
Each candlestick typically will have a middle build point that shows the distance between the opening and the closing of the cryptocurrency being traded. The top “Wick '' represents the top of the body and the high for the trading period. The bottom wick is the distance in price between the bottom of the body and the low for the trading period. Each candlestick addresses a particular time frame (a month, a minute, or depending on the trader).
So a candlestick will provide five major information to a trader:
Candlestick charts have two main characteristics you should know. They include:
Time Selection
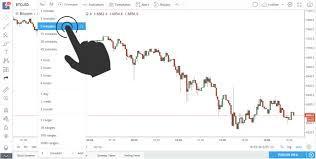
The crypto candlestick chart will allow you to choose the timeframe the candlestick will represent. What this means is that the candlestick will only show the transactions that occur for the timeframe you selected. The timeframe is up to you. It can be anything from 5 minutes to months.
Volume
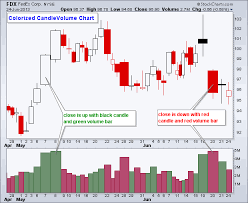
The second characteristic of the candlestick is the volume it represents. The candlestick will not only represent the timeframe but also the volume of the cryptocurrency traded in that time. The volume of the cryptocurrency is determined by how much people buy or sell.
A green indicator on the volume bar means that interest on the cryptocurrency is good. On the other hand, a red indicator means interest is dropping.
Types of Candlesticks
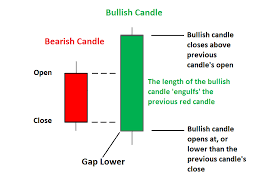
There are two types of candlesticks in terms of how the cryptocurrency is moving on the market. They are the Bullish and Bearish candlesticks.
Earlier we briefly explained the meaning of these terms. But now in reading crypto charts, you must get an overview of the patterns these candlesticks make.
Knowing the patterns are a great way to read candlestick charts and interpret the movement of the market. Why? Because trends and patterns are often repetitive and learning what a pattern means can be a great advantage.
To be continued…
Phew, that was a lot of new information, and now you might need some time to process all of it to fully understand. In the next chapter, we will explore the Bullish patterns and how certain people make a profit while others seem to be losing.